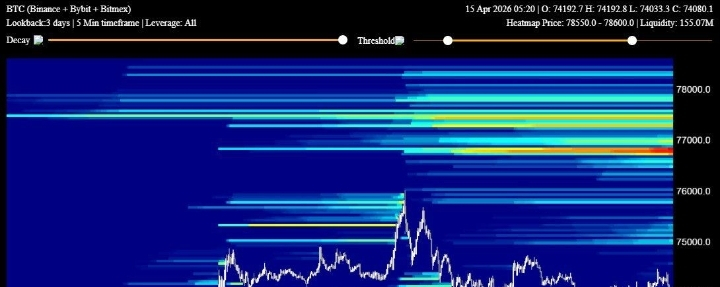
The latest Bitcoin ($BTC) 3D liquidation heatmap is flashing a critical signal for traders and investors alike. Data shows a significant concentration of late long positions building up in the $71,500 – $73,500 range — a zone now packed with potential liquidity.
This type of positioning often indicates that retail traders are entering the market late, chasing upward momentum. Historically, such clusters tend to become liquidity targets for larger market participants (smart money), increasing the probability of a downside move.
📉 Market Bias: Bearish
With excessive longs stacked in a tight range, the market structure suggests a higher likelihood of a liquidation sweep below current levels. If price starts moving downward, it could trigger a cascade of forced liquidations, accelerating the drop.
⚠️ What Traders Should Watch:
• A breakdown below the $71.5K level could confirm bearish momentum
• Increased volatility as liquidity zones get tested
• Potential fakeouts before the actual move (common in liquidity hunts)
#Bitcoin #BTC #CryptoTrading #CryptoNews #TechnicalAnalysis

