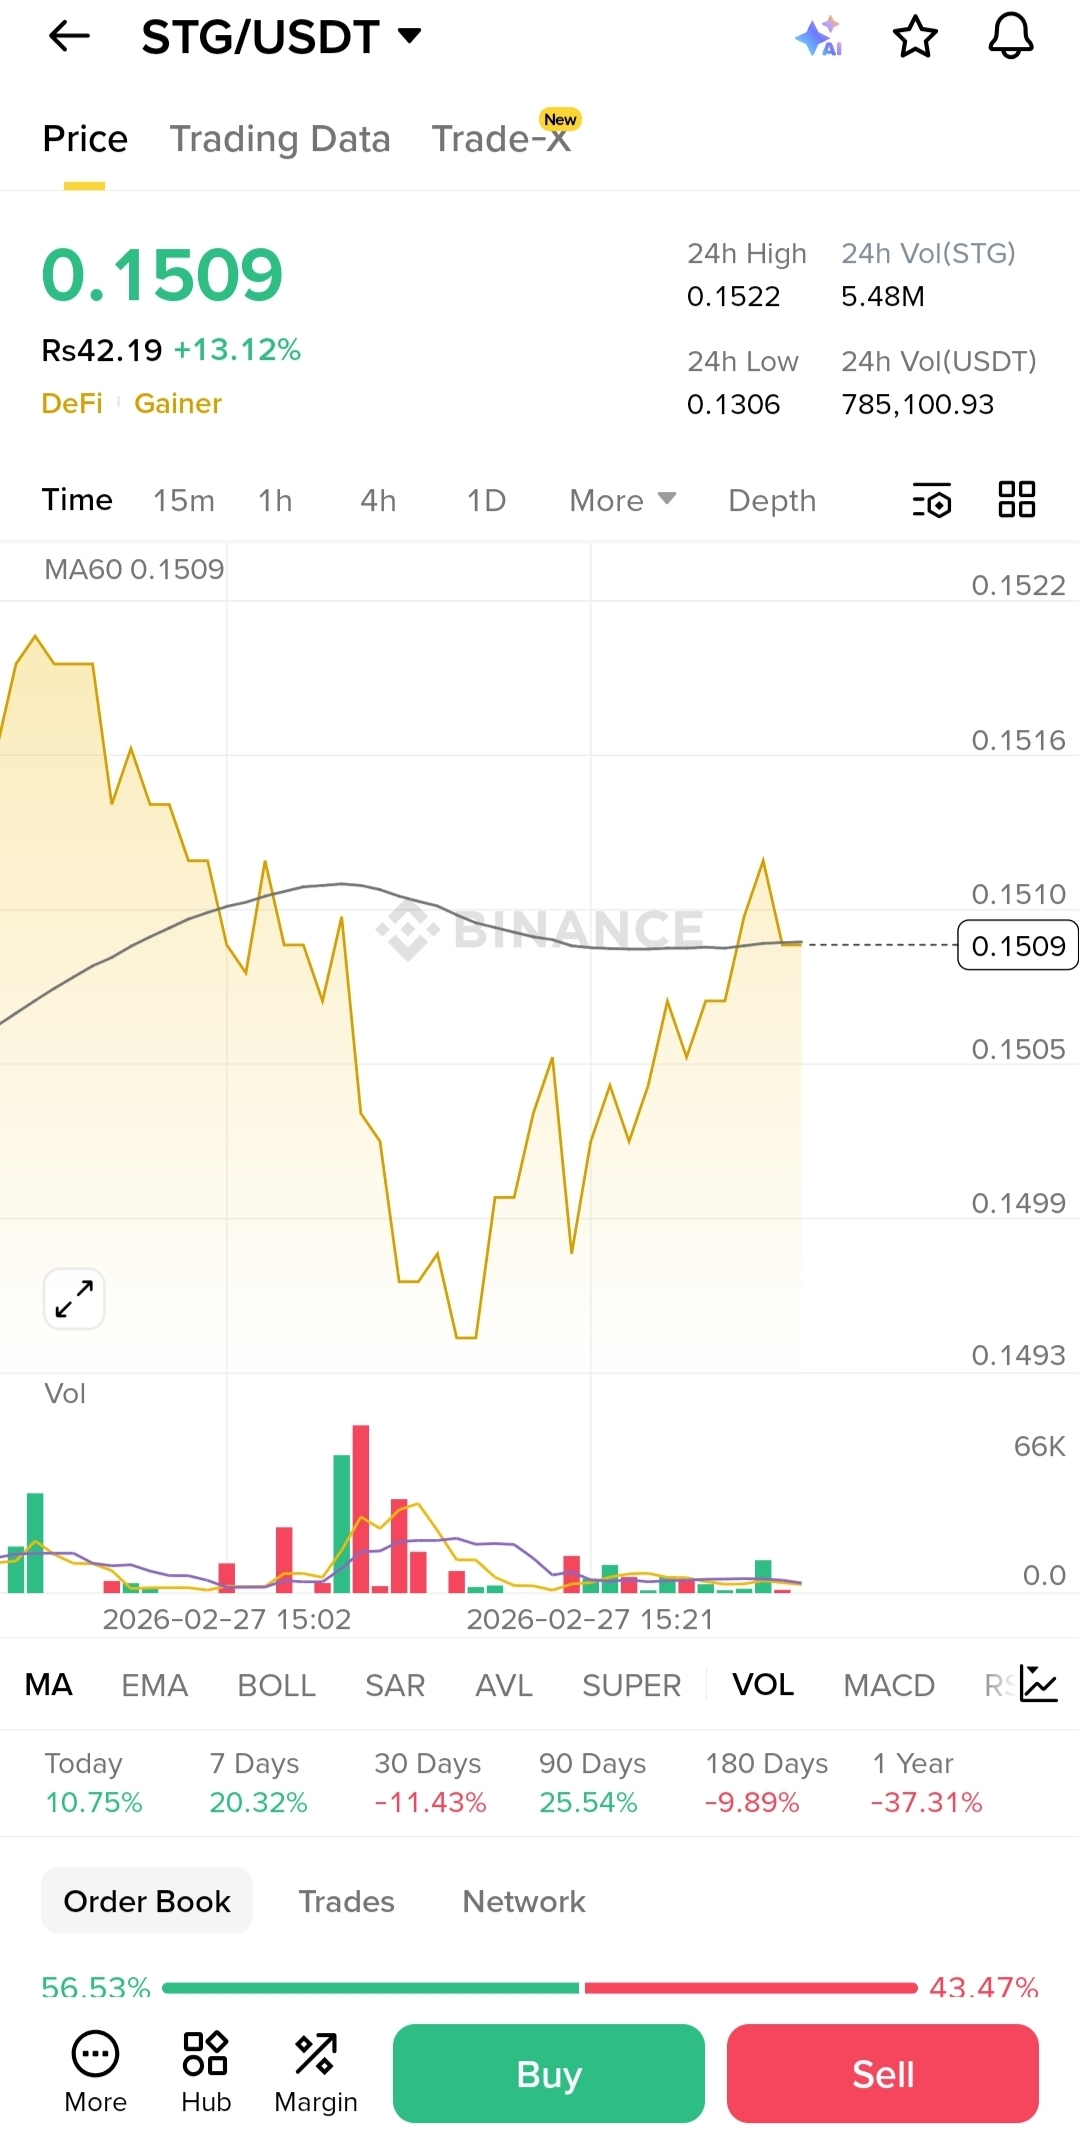
$STG is showing strong intraday momentum, climbing more than 7% today and pressing directly into a key resistance zone around $0.1526. This level is not just a random price ceiling — it represents a structural barrier where previous upside attempts stalled.
Right now, the market is at a decision point.
📊 Market Structure Insight
The recent push into $0.1526 suggests increasing bullish pressure. Buyers are stepping in aggressively, and momentum indicators are beginning to tilt upward. However, resistance is where weak hands take profit and strong hands build continuation positions.
A clean breakout above $0.1526, followed by a healthy retest and hold, would confirm that former resistance has flipped into support — a classic bullish continuation pattern.
That confirmation could unlock a stronger impulsive move.
🎯 Upside Targets If Breakout Confirms
If price successfully breaks and retests:
🎯 Target 1: $0.1689
🎯 Target 2: $0.2023
The move toward $0.1689 represents the first liquidity pocket above resistance. Beyond that, $0.2023 becomes the higher-timeframe magnet, where momentum traders and breakout buyers may accelerate the rally.
⚠️ What If It Fails?
If $STG rejects at $0.1526 and fails to hold above it, we may see a pullback toward lower support zones before another attempt. Patience is key — chasing resistance without confirmation increases risk.
📢 Trading Signal
🟢 Signal Type: Breakout Confirmation Trade
📍 Trigger: Daily or 4H close above $0.1526
🔁 Confirmation: Successful retest and hold above $0.1526
🎯 Targets: $0.1689 / $0.2023
🛑 Invalidation: Sustained rejection below resistance
This is not about reacting emotionally to a 7% pump — it’s about waiting for structure to confirm strength. Smart money waits for confirmation.
If the breakout holds, $STG could transition from short-term momentum play into a broader bullish expansion phase.
Stay disciplined. Let the chart confirm the story.
#STG #CryptoSignals #AltcoinBreakout #TechnicalAnalysis #TradeSetup