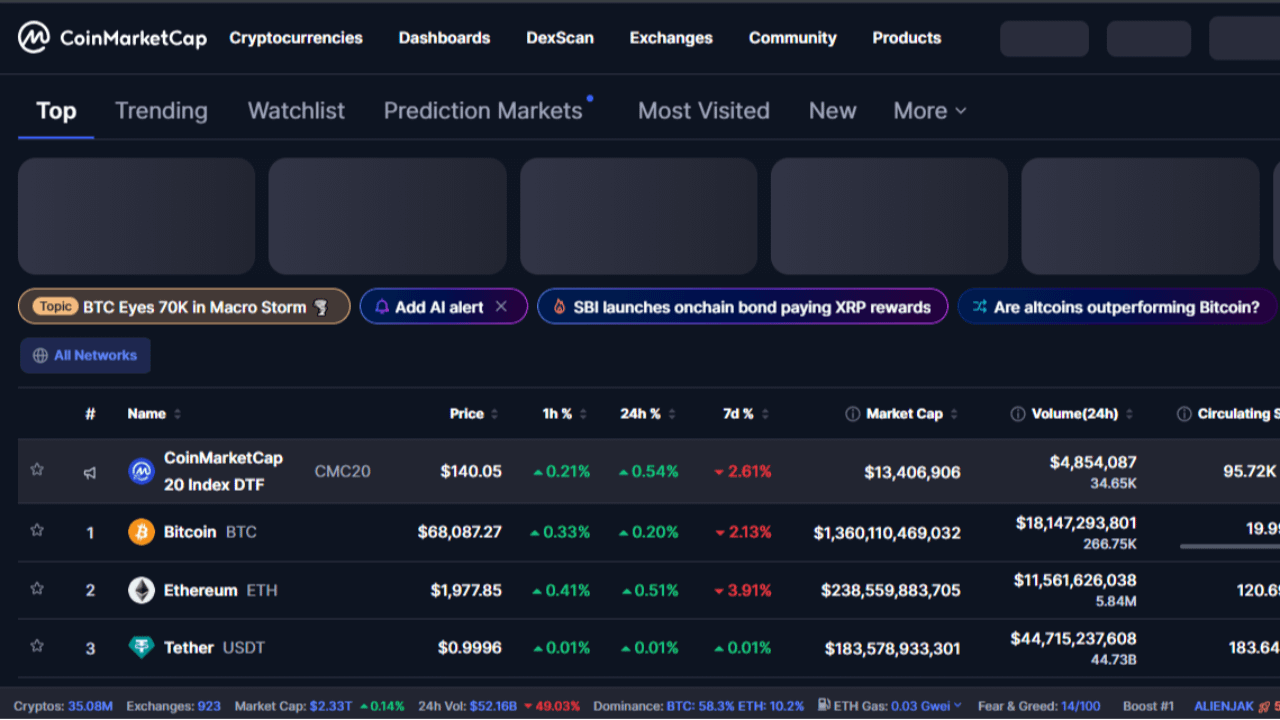
This screenshot shows the homepage of CoinMarketCap, specifically the “Top Cryptocurrencies” section. CoinMarketCap is one of the most popular cryptocurrency data tracking platforms in the world. It provides live prices, market capitalization, trading volume, supply data, rankings, and charts for thousands of cryptocurrencies.
Let’s break down everything visible in this image step by step.
TOP NAVIGATION BAR
At the very top of the page, there is a dark blue navigation bar. On the left side, you can see the CoinMarketCap logo. This logo identifies the platform and serves as a clickable link back to the homepage.
Next to the logo, there are several main navigation menu options:
• Cryptocurrencies
• Dashboards
• DexScan
• Exchanges
• Community
• Products
Each of these menu options leads to different sections of the website:
Cryptocurrencies – This section lists all available cryptocurrencies along with their prices and rankings.
Dashboards – Users can create personalized dashboards to track selected coins.
DexScan – This section tracks decentralized exchanges and on-chain trading activity.
Exchanges – Displays rankings and data for centralized and decentralized crypto exchanges.
Community – A place for discussions, updates, and social interaction related to crypto.
Products – Lists tools and additional services offered by CoinMarketCap.
On the right side of the header, there are some grey placeholder boxes. These likely represent account options such as login, sign up, profile, notifications, or advertisements.
SECONDARY MENU (CATEGORY TABS)
Below the main navigation bar, there is another menu row with category tabs:
• Top (currently selected)
• Trending
• Watchlist
• Prediction Markets
• Most Visited
• New
• More
The “Top” tab is highlighted, meaning this page is currently displaying the top cryptocurrencies ranked by market capitalization.
Trending – Shows coins that are gaining attention.
Watchlist – Displays coins saved by the user.
Prediction Markets – Likely related to market forecasting or speculative platforms.
Most Visited – Coins that receive the most page visits.
New – Newly listed cryptocurrencies.
More – Additional categories.
NEWS / TOPIC BANNERS
Under the category tabs, there are colored topic banners or news strips. These appear to highlight trending discussions or news headlines. The visible topics include:
• BTC Eyes 70K in Macro Storm
• Add AI Alert
• SBI Launches Onchain Bond Paying XRP Rewards
• Are Altcoins Outperforming Bitcoin?
• What Are the Trending...
These banners are clickable and likely lead to news articles, blog posts, or analysis pieces. They help users stay updated with the latest crypto developments.
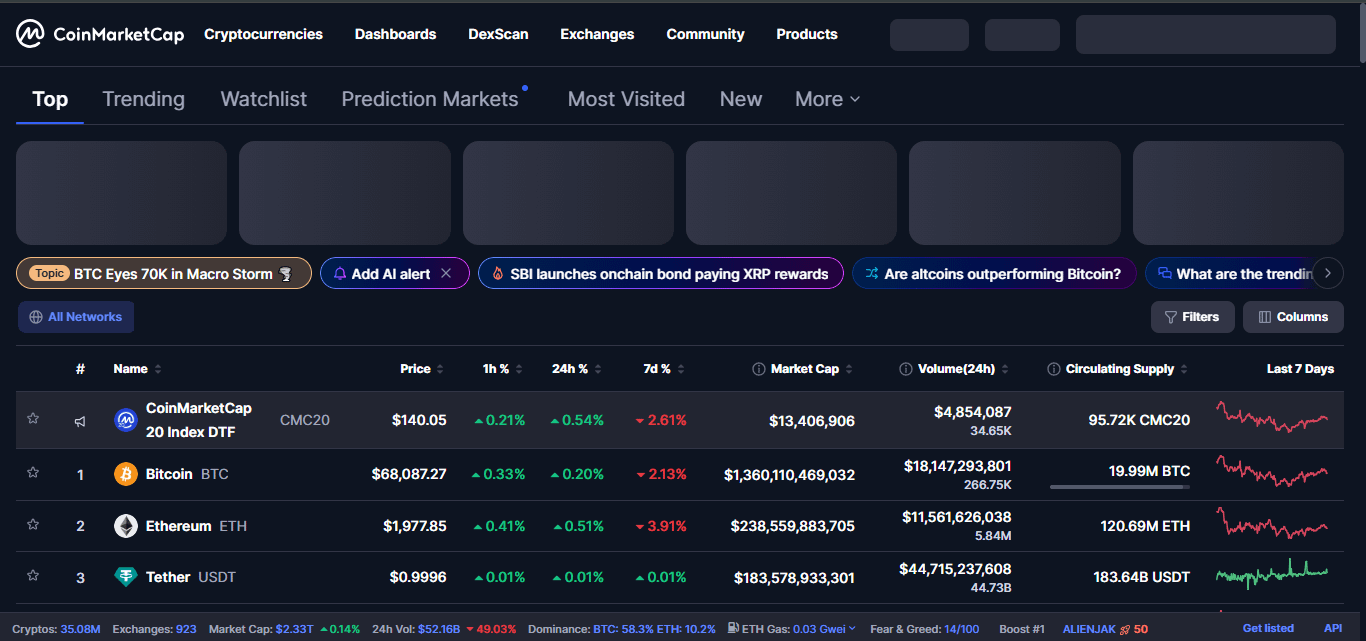
FILTERS AND COLUMNS OPTIONS
On the right side above the table, there are two buttons:
• Filters
• Columns
Filters allow users to narrow down the list based on specific criteria. For example, users can filter by categories like DeFi, NFTs, Stablecoins, Layer 1, Layer 2, and more.
Columns allow users to customize what data fields are displayed in the table. For example, users might choose to show or hide supply, fully diluted valuation, or other metrics.
MAIN CRYPTOCURRENCY TABLE STRUCTURE
The main part of the page is a data table listing cryptocurrencies. The table includes several columns:
Rank (#)
Name
Price
1h % (1-hour percentage change)
24h % (24-hour percentage change)
7d % (7-day percentage change)
Market Cap
Volume (24h)
Circulating Supply
Last 7 Days (Mini chart)
Each row represents one cryptocurrency.
COINMARKETCAP 20 INDEX (CMC20)
The first row displayed is “CoinMarketCap 20 Index DTF (CMC20).”
This appears to be an index product rather than a traditional cryptocurrency.
Details shown:
Price: $140.05
1h Change: +0.21%
24h Change: +0.54%
7d Change: -2.61%
Market Cap: $13,406,906
24h Volume: $4,854,087
Circulating Supply: 95.72K CMC20
On the far right, there is a small 7-day line chart in red color, indicating that the price trend over the past week has been slightly downward.
RANK #1 – BITCOIN (BTC)
Rank #1 is Bitcoin, the largest cryptocurrency in the world by market capitalization.
Details displayed:
Price: $68,087.27
1h Change: +0.33%
24h Change: +0.20%
7d Change: -2.13%
Market Cap: $1,360,110,469,032 (over 1.36 trillion dollars)
24h Volume: $18,147,293,801
Circulating Supply: 19.99 million BTC
The 7-day mini chart shows a red trend line, indicating that Bitcoin’s price has slightly decreased over the past week.
Bitcoin dominates the crypto market and usually has the highest trading volume and market cap.
RANK #2 – ETHEREUM (ETH)
Rank #2 is Ethereum.
Details displayed:
Price: $1,977.85
1h Change: +0.41%
24h Change: +0.51%
7d Change: -3.91%
Market Cap: $238,559,883,705
24h Volume: $11,561,626,038
Circulating Supply: 120.69 million ETH
The 7-day chart is red, showing that Ethereum’s price has declined over the last week.
Ethereum is the second-largest cryptocurrency and is known for smart contracts and decentralized applications.
RANK #3 – TETHER (USDT)
Rank #3 is Tether (USDT), which is a stablecoin.
Details displayed:
Price: $0.9996 (very close to $1)
1h Change: +0.01%
24h Change: +0.01%
7d Change: +0.01%
Market Cap: $183,578,933,301
24h Volume: $44,715,237,608
Circulating Supply: 183.64 billion USDT
The 7-day chart shows a stable flat trend, as expected from a stablecoin.
Tether is designed to maintain a 1:1 value with the US dollar.
BOTTOM GLOBAL MARKET STATISTICS
At the bottom of the screenshot, there is a global crypto market summary bar. It includes:
• Total Cryptocurrencies: 35.08M
• Total Exchanges: 923
• Total Market Cap: $2.33T
• Market Change: +0.14%
• 24h Volume: $52.16B
• Volume Change: -49.03%
• Bitcoin Dominance: 58.3%
• Ethereum Dominance: 10.2%
• ETH Gas: 0.03 Gwei
• Fear & Greed Index: 14/100
• Boost #1
• Alienjak 50
• Get Listed
• API
These metrics provide an overview of the entire cryptocurrency market.
Bitcoin dominance (58.3%) means Bitcoin holds 58.3% of the total crypto market capitalization.
Ethereum dominance (10.2%) shows Ethereum’s share.
Fear & Greed Index at 14/100 suggests extreme fear in the market.
COLOR INDICATORS
Green percentages indicate price increases.
Red percentages indicate price decreases.
This makes it easy to visually understand which coins are gaining and which are losing value.
MINI 7-DAY CHARTS
On the far right of each row, there is a small sparkline chart representing price movement over the past 7 days.
Red lines show downward trends.
Green lines show upward trends.
These mini charts help traders quickly assess short-term performance.
In summary, this screenshot represents the main market overview page of CoinMarketCap. It shows the top-ranked cryptocurrencies based on market capitalization, along with their prices, percentage changes, trading volumes, circulating supply, and 7-day price trends. The page also includes navigation menus, trending news banners, filtering options, and overall market statistics.
It provides a complete snapshot of the current cryptocurrency market situation in a single screen.
