Deep analysis of the BTC/USDT chart (Binance mobile app screenshot, 1-hour timeframe.
1. Current Price Snapshot
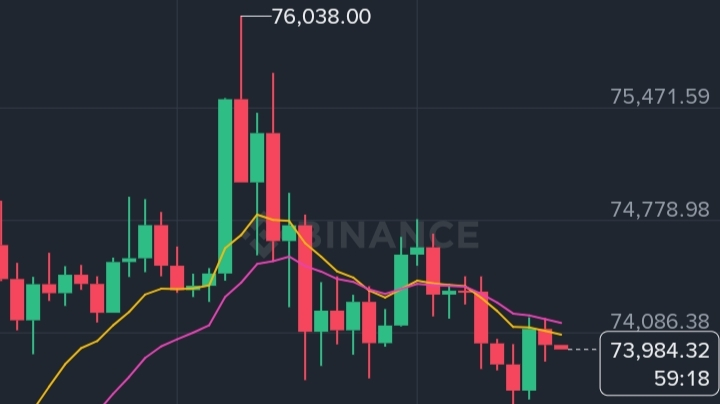
Spot price: 73,984.32 USDT
24-hour range: 73,514.00 (low) → 76,038.00 (high)
→ That’s a ~3.4% intraday swing — very high volatility even for Bitcoin.
24h change shown: -0.67% (this appears to be the most recent hourly or short-term change; the “Today” figure below is -1.05%).
Volume: 24,168.79 BTC traded (~1.80B USDT notional). Solid liquidity, nothing extreme.
2. What the Candlestick Chart is Showing (1H timeframe)
The move in one picture:
Strong bullish surge earlier (multiple green candles + a very tall green candle that spiked straight up to the 76,038 high).
Immediate violent rejection at 76k — you can see the long upper wick and then a series of red (bearish) candles hammering price down.
Price crashed all the way to the 24h low of 73,514.
Very recent small green candle trying to stabilize around 73,984.
This is a classic “bull trap / fakeout” pattern on the hourly chart: price broke higher with conviction, sucked in buyers, then reversed hard. The big red candles after the peak show heavy selling pressure.
3. Technical Indicators on the Chart
EMA(9): 74,075.72 (yellow line)
EMA(15): 74,147.43 (magenta/pink line)
Key signal: Price is currently below both EMAs, and the EMAs themselves are flattening/rolling over.
→ Short-term momentum has flipped bearish. As long as price stays under ~74,100–74,150, the bears are in control on this timeframe.
No Bollinger Bands, SAR, etc. are overlaid in this view, but you have the tabs ready if you want to switch.
4. Broader Timeframe Context (shown at the bottom)
Period
Performance
Interpretation
Today
-1.05%
Still red today
7 Days
+7.67%
Decent short-term recovery
30 Days
+2.94%
Mildly positive
90 Days
-23.68%
Deep correction
180 Days
-31.66%
Major downtrend
1 Year
-12.82%
Still negative YOY
Bitcoin is in a medium-to-long-term downtrend or extended correction phase (typical post-bull-run behavior). The 7-day gain was probably the bounce that just got rejected at 76k.
5. Order Book Pressure (bottom bar)
76.60% green (buy side) vs 23.40% red (sell side)
This is a strong buy-side imbalance in the visible order book. It suggests:
Plenty of resting buy orders below current price (potential support).
Sellers are thin right now.
This often precedes a short-term bounce or at least a pause in the selling — but it can also be “fake liquidity” that gets eaten through if big sellers step in.
6. Overall Story Right Now
What happened: BTC had a sharp liquidity-grab rally to 76k, got rejected hard, and is now giving back almost the entire move in just a few hours.
Current regime: Short-term bearish (price below EMAs, red candle dominance).
Bias: The market is in a volatile consolidation/correction phase. The 76k level acted as strong resistance.
Near-term levels to watch:
Support: 73,514 (today’s low) → if broken, next major support is likely lower (not shown on this chart).
Resistance: 74,075–74,147 (the two EMAs) → reclaiming these would be the first sign bulls are back.
Major resistance: 76,038 (today’s high).
Bottom line: This is a high-volatility rejection day. Bulls tried to push higher but failed decisively. Price action right now favors the bears on the hourly chart, but the heavy buy-side order book and the fact that we’re already near the 24h low means a relief bounce is possible at any moment.
