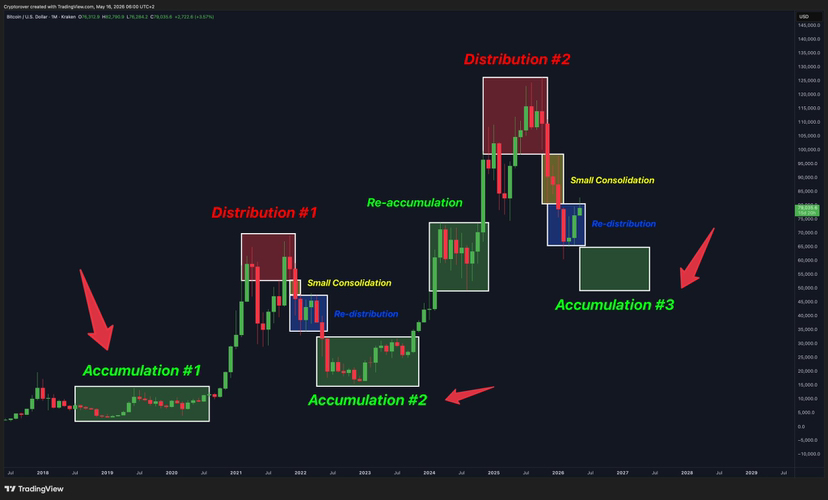
This chart is showing a classic market cycle structure for Bitcoin on the monthly timeframe using the concepts of:
• Accumulation
• Distribution
• Re-accumulation
• Re-distribution
Here’s the expanded breakdown of what the creator is trying to communicate:
Phase 1 — Accumulation #1 (2018–2020)
The green box at the bottom represents a long sideways market after the 2017 bull run crash.
What happens here:
• Smart money slowly buys BTC while public interest is low.
• Fear is high.
• Price moves sideways for months.
Psychology:
• Retail investors think Bitcoin is “dead.”
• Institutions and whales quietly accumulate.
Result:
A massive breakout starts the next bull market.
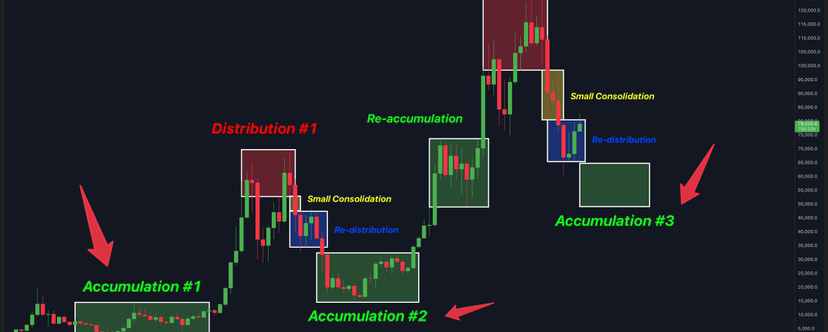
Phase 2 — Distribution #1 (2021)
The red box near the first major top.
What happens:
• Early buyers begin taking profits.
• Price becomes volatile.
• Retail FOMO enters aggressively.
Signs:
• Large candles
• Extreme optimism
• Media hype
Then:
Price weakens and drops.
Small Consolidation + Re-distribution (2021–2022)
The yellow and blue zones show temporary pauses during the downtrend.
Meaning:
This is not true accumulation yet.
Instead:
• Large holders continue selling into rebounds.
• Market creates false hope before another drop.
This leads into the 2022 bear market.
Accumulation #2 (2022–2023)
Another green box after the bear market crash.
Similar to 2019:
• Sideways movement
• Fear and boredom
• Smart money buying again
Then:
BTC breaks upward again.
This starts the next bullish expansion.
Re-accumulation (2024)
This section suggests:
• The uptrend pauses temporarily.
• Buyers absorb supply.
• Market prepares for another leg higher.
Difference from accumulation:
Re-accumulation happens INSIDE an existing uptrend.
Distribution #2 (2025)
The second red zone near the projected top.
Interpretation:
The chart creator believes:
• BTC forms another major top around $110k–$125k.
• Smart money starts exiting again.
Typical signs:
• Euphoria
• Meme mania
• Retail overconfidence
• Parabolic moves
Current Structure (2026 area)
The chart suggests Bitcoin may currently be in:
Small Consolidation
followed by
Re-distribution
Meaning:
• Price may still chop sideways.
• Weak bounces occur.
• Larger players continue unloading positions.
Predicted Future — Accumulation #3
The final green box projects another long-term accumulation phase around lower prices.
The idea:
After the bull market peak and correction:
• BTC enters another multi-month or multi-year base.
• Cycle repeats again.
Core Message of the Chart
The creator is emphasizing that:
Markets move in repeating cycles:
1. Accumulation
2. Markup (bull run)
3. Distribution
4. Markdown (bear market)
Then repeat.
This is heavily inspired by:
• Wyckoff theory
• Smart money concepts
• Bitcoin 4-year cycle analysis
Important Note
This is still a speculative projection, not certainty.
Bitcoin cycles can:
• Extend longer
• Top earlier
• Break historical patterns
Especially now because:
• Spot ETFs changed market structure
• Institutions participate heavily
• Global liquidity matters more than previous cycles
So this chart is best used as a framework, not a guaranteed roadmap.