Ethereum$ETH is showing early signs of recovery after a sharp correction on the 1-hour timeframe. After falling from the recent local high near $2,423, ETH$ETH found strong buying pressure around the $2,265 support zone, and bulls are now attempting to regain short-term momentum.
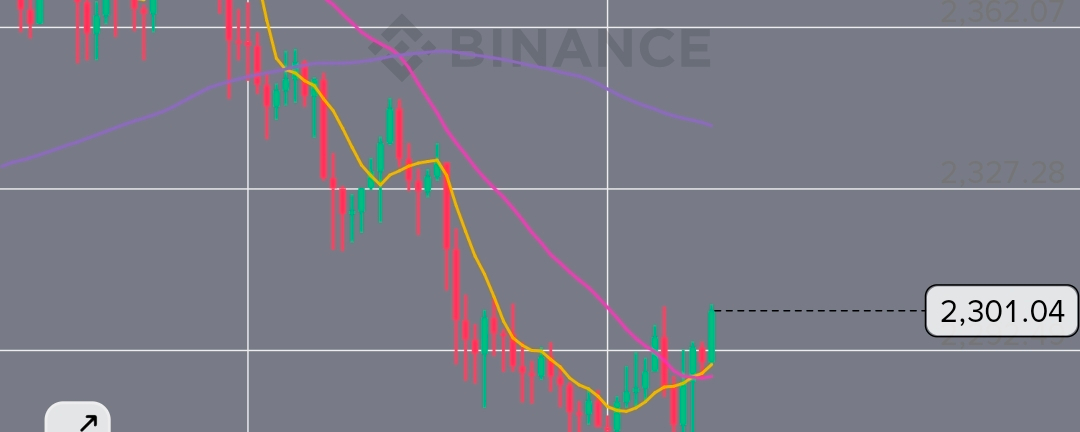
Currently trading around $2,301, ETH$ETH has managed to climb back above its short moving averages, signaling that buyers are slowly returning to the market.
What the Chart Shows
The recent downtrend pushed Ethereum into oversold territory, but the bounce from $2,265 suggests that traders are defending this level aggressively. Volume activity has also started to increase during the rebound phase, which often indicates renewed market interest.
On the chart:
MA(7) is turning upward, showing short-term strength.
ETH is attempting to reclaim the MA(25) resistance area.
The major resistance remains near $2,304–$2,327.
Stronger bullish confirmation could appear if price breaks above $2,360.
Key Levels to Watch
Support Zones
$2,265 — major short-term support
$2,230 — next bearish target if support fails
Resistance Zones
$2,304 — immediate resistance
$2,327 — stronger breakout level
$2,423 — recent swing high
Trading Outlook
If ETH continues holding above the current support range, momentum traders may target a move toward higher resistance levels. However, rejection near resistance could still trigger another retest of support before any larger trend reversal happens.
Right now, the market structure suggests a possible short-term recovery, but confirmation will depend on volume and breakout strength.
As always, risk management remains the key in volatile crypto conditions.