Avalanche is showing signs of weakness after failing to move above an important price level. The recent move in the chart suggests the rally may be losing strength. If this pattern continues the token could see another drop in the coming days.
At the moment AVAX is trading near nine dollars and fifty seven cents. During the last day the price moved up slightly by about two percent. The highest price during the day was close to nine dollars and ninety three cents. Even though the price rise was small trading activity increased strongly. Daily trading volume climbed above three hundred eighty million dollars which shows that many traders are still active in the market.
Some market watchers believe the token could still make a strong move if a breakout happens. A chart shared by a market analyst showed that AVAX may be forming a pattern that often leads to an upward breakout. If buyers manage to push the price above the key level the token could start a fresh rally.
However the shorter time chart shows a different picture. Since early February the price has mostly moved inside a clear price range. The upper area of this range sits close to nine dollars and seventy seven cents while the lower area sits near eight dollars and twenty five cents.
During the past weeks every time the price touched the top of this range it quickly moved back down. The same thing also happened when the price reached the bottom of the range. Each time buyers pushed the price up from that lower level.
Now the price is once again near the upper edge of the range. The chart shows that the price tried to move above this level but sellers pushed it back. This type of rejection often means buyers are losing strength at that level.
If the price stays below nine dollars and seventy seven cents the token could follow the same pattern seen earlier. In that case the market may slowly move down toward the lower part of the range again. This would place the next possible target close to eight dollars and twenty five cents which would mean a drop of around thirteen percent from the recent price.
Another signal comes from an indicator that measures how strong a trend is. The current reading is above thirty which usually means the market has strong movement in one direction. When this happens price moves can become faster either up or down.
Market activity also shows that many traders may be preparing for a possible drop. A noticeable amount of AVAX has recently been moved toward trading platforms. When tokens move there it often means holders are getting ready to sell.
Short term traders also appear cautious. Data shows that more traders are placing positions that profit from falling prices rather than rising prices. This suggests that many market participants expect the token to struggle near the current level.
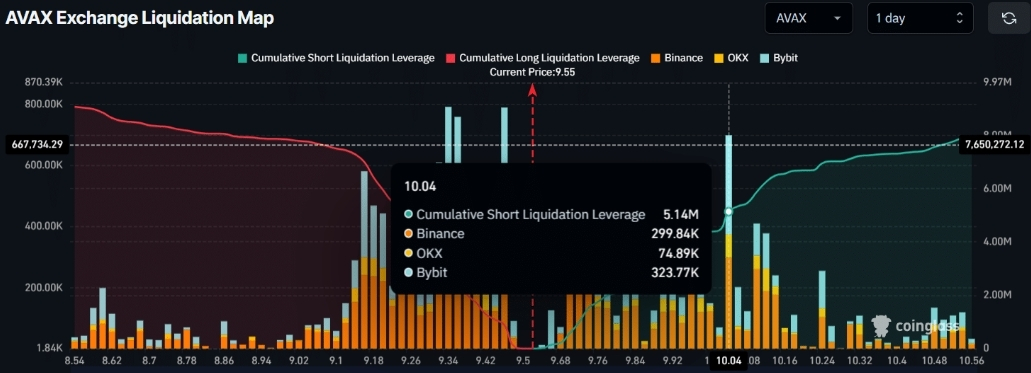
Leverage data also highlights two important areas. Around nine dollars and thirty four cents traders hold many buy positions that act as support. Near ten dollars and four cents many sell positions are waiting which creates resistance above the market.
The value of positions betting on a price drop is currently higher than the value of positions betting on a price rise. This difference shows that bearish sentiment is slightly stronger at the moment.
In simple terms AVAX is sitting at an important point on the chart. If buyers manage to break the resistance level the token could try to move higher. If the rejection continues the price may follow the earlier pattern and move back toward the lower part of the range near eight dollars and twenty five cents.